 Rui Carmo
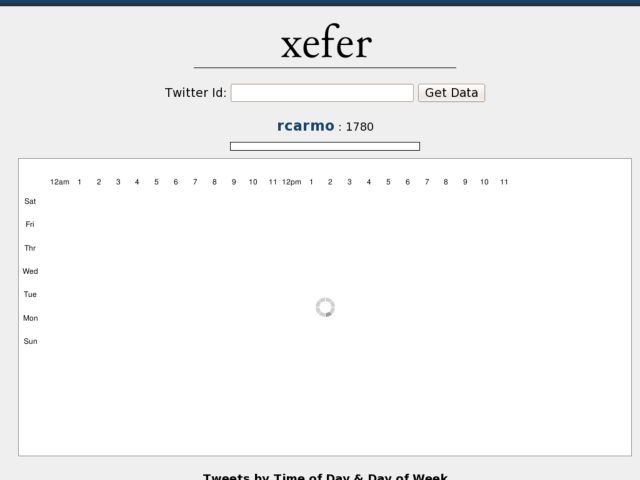
A composite Twitter activity chart, built with Pipes and the Google charting API - great inspiration for visualizing time-based data (JavaScript source).
A composite Twitter activity chart, built with Pipes and the Google charting API - great inspiration for visualizing time-based data (JavaScript source).